Wednesday, May 21, 2014

Dissection Lab

Starfish Dissection


The Plycocic  Checa is the digestive glands that are found running down the arms of the starfish. they help to break down the food it eats.
zzz3.PNG
water enters the starfish through the madreporite located next to the central disk.

zzz.PNG

the water that has entered the ring canal and then flows through the rest of the body through the lateral canal.


zzz2.PNG
The mouth is found on the bottom of the starfish and so are the tube feet. the tube feet allow the starfish to move, by pushing water into the feet and filling them up which then makes it so it can move around.


zzz1.PNG
Incision guide.
at one  cut off the tip.
at 2 cut down the center of the stars arm
at 3 cut out the circular disk

star.PNG


Earthworm Dissection
External Anatomy:

The earthworm appears very simple and plain to the naked eye, but when looked at up close, it’s very detailed and intricate. When looked at from a distance, the first thing noticed on the body is the clitellum. It is almost like a swollen part of the worm on it’s dorsal surface. The clitellum is responsible for secreting a mucus sheath which surrounds the worm while mating and creates a cocoon for the fertilized eggs. The anterior portion is a lot more flattened which allows it to drag itself more efficiently. On the dorsal side of the worm there are many bristle like spines called setae which almost allow the worm to carve through the ground and dirt. Extending from the clitellum we also have pores which can act as male or female genitalia.

Internal Anatomy:
Many would think that the earthworm is nothing special and just a long tube like simple creature. From the outside it appears to be true, but when looking at the internal anatomy it’s the complete opposite. Digestion begins in the oral cavity with the mouth and buccal cavity. The esophagus follows the pharynx and leads in a crop which is a reserve stomach. Posterior to the crop is the gizzard, which is a muscular organ responsible for churning the soil and ground ingested by the worm. The large intestine follows the gizzard in which the majority of digestion and absorptionccur. Whatever is not digested in excreted through the anus.


Dissection:                  


Frog Dissection
1. Cut along the sides of frog's mouth in order to better see inside of frogs mouth


2. Turn the frog over and cut the frog along the red lines and use the pins to hold the skin of frog down


Frogs are amphibians and live on land and in the water. The frog has 2 external nares that allow it to breathe. The frog's tympani are its eardrums. It also has 2 eyes on the side of its face and each eye has 3 eyelids.
IMG_1125.PNG

Inside the mouth there are vomerine teeth and maxillary teeth that help frogs capture prey.
IMG_1126.PNG

Inside of the frog there is the stomach, which is where food is digested and broken down. The small intestine is the location where the nutrients from food are absorbed. The frog's liver produces bile which is used during the digestion process. The function of the pancreas is to help digestion by producing insulin. In a female frog, the ovary produces eggs that are later fertilized by a male frog's sperm.
IMG_1127.PNG
IMG_1128.PNG


Clam
External Anatomy:
A clam is surrounded by two hard shells made of calcium. the hinge ligament allows the clam to open and close. It is tough, but also pliable, in order to open as much as it needs. On top of the hinge the bump, called the umbo, is the oldest section of the clam. As the clam grows, it produces growth rings all over the shell.


Internal Anatomy:

The adductor muscles are used to close the shell in order for the clam to avoid predators. The muscular foot can reach outside of the clam and allow it to bury itself whenever needed. Without the mantle, the clam would not have protection. The mantle secretes calcium carbonate which is what forms the hard outer shell. On the inside there are also gills which serve a vital part. The gills allow the clam to obtain oxygen, and get food. The cillia on the gills create current which moves the water through the clam body. Also located inside are digestive glands which aid in digestion and gonads which play a major role in reproduction.


Friday, March 7, 2014

pGLO Lab

Purpose: The purpose of this lab was to perform genetic transformation by moving genes from one organism to another with the help of a plasmid. By doing this, we could make incorporate pGLO into cells and make them glow.

Intro: Genes can be spliced into a cell in order to alter the makeup of the cell. In our lab we spliced a "pglo" gene into EColi bacteria in order to make it resistant to ampicillin. This the presence of the pglo gene will allow the EColi to glow under an Ultra violet light. Without the pglo the bacteria will die once introduced with ampicillin. The activator for the pglo gene is arabonose sugar, so when arabonose is present the bacteria will grow more.

Methods: First we transfered 250 ul of CaCl2 into test tubes labeled +pGLO and -pGLO and then placed them in ice.


Then we moved bacteria from the starter plate into the tubes by scraping it from the plate with a loop and swirling it into the solution as shown in the picture. And then we placed the tubes back in ice.

Then pGLO plasmid DNA was added to the +pGLO tube but no the -pGLO tube. The test tubes were placed in ice for 10 minutes before being placed in a hot water bath for 50 seconds to heat shock them.

The tubes were placed back in ice for 2 minutes and then removed. Then 250 ul of LB nutrient broth was added to both tubes and they were mixed.

 Finally 100 ul of the tubes solution were added to their respective plates, +pGLO LB/amp, +pGLO LB/amp/ara, -pGLO LB/amp, -pGLO LB.

The suspension was spread evenly on the plates and then they were left alone for a day.
Data:


This is the picture of the base bacteria that we took the sample from to spread it to all of our plates

(from left to right top to bottom) ampicillin was added to the plate but the ere was pglo so it was able to resist and survive, thus showing some growth. then there is lots of growth on the LB because there was just regular conditions for the bacteria to grow in. next there was marginally more growth in the amp/ara because there was the activator arabinose which  makes the pglo more active. and because of the pglo the ampicillen did not kill the bacteria. finally there is nothing in the last tray because the bacteria did not have the pglo gene in order to make it resistant to ampicillin so it died.
 picture showing that none of the other trays but the LB/AMP/ARA is glowing because it has the activator to make the pglo glow.
 the arabonose dish before UV                                     the arabinose dish after UV


Discussion: In our base group with just the EColi gene there was massive amounts of growth, and the entire dish was full. Where in the plain EColi gene introduced with ampicillin there was nothing in the tray because all the bacteria was killed. Then in the pglo enhanced EColi gene there was actually growth on the ampicillin tray, but there was not that much. This is because not all of the bacteria cells become resistant to the ampicillin. So the ones that weren't resistant died. Then finally the pglo bacteria introduced to the ampicillin and arabonose sugar was able to grow more because pglo becomes active when arabonose is present so it grew more than without the arabonose. But not nearly as much as the base dish.

Conclusion: The objective and process of this lab was to move genes from one organism to another by using the help of a plasmid. The pGlo plasmid we used had a gene which was encoded for GFP (green fluorescent protein), was altered with both arabinose or ampicillin. Each of the four dishes in which the plasmid was placed had a different component as explained above. The dish labeled with LB/ARA/AMP was able to glow in the dark which gave us a clear result on the test. The others did not, as predicted.

Friday, December 20, 2013

Cellular Communication Lab

Purpose:
The purpose of this lab was to see the effect of time on the mating on yeast cells. The dependent variable which was controlled was time. Yeast was kept for 30 minutes, 24 hours, and 48 hours. The independent variable was the number of yeast.
Introduction: 
Cells communicate through signals that can either be local or long-distance. Signal transduction pathway is a series of steps in which a received signal is converted to a specific cellular response. There are 3 stages in cell signaling: reception, transduction, and a response. During reception, a target cell detects a chemical signal when the signaling molecule binds to a receptor protein. There are 3 major types of cell-surface transmembrane receptors: G protein-coupled receptors, receptor tyrosine kinases, and ion channel receptors. During transduction, the receptor protein is changed and the signal is converted to a form that leads to a specific cellular response. The multiple steps in transduction leads to amplification of the signal. 2nd messengers, such as cyclic AMP can also play a role in signal transduction pathways. Finally, the cellular response is triggered by the transducer signal. Cells of the yeast saccharomyces cervisiae, find their mates through chemical signaling and then initiate the mating process. The 2 mating types of yeast, a & alpha, secrete factors that bind to the receptor proteins on the other type of cell. When these factors bind to the receptors, the 2 cells grow toward each other and fuse together. The new a/alpha cell contains all of the genes from both cells.
Methods: 
Yeast was obtained and dropped into three tubes of water. The tubes were labeled with alpha type, A-type and mixed. Different  yeast was added to each tube, and a mix was added to the tube labeled "mixed." A reading was taken right away and yeast cells were counted. After 30 minutes, yeast cells were counted once again to see the reproduction. This was repeated once again after 24 hours and 48 hours. The yeast was  split into three groups: alpha, a-type and mixed.  Single haploid cells, budding haploid cells, shmoos, single zygotes, budding zygotes, and asci's  were the type of cells that were accounted for under the microscope. After each slide was used and counted for, the slides were cleaned in bleach, in order to sterilize and zap the yeast to its death.   
Data:


Graphs:

Alfa type


A type
Mixed type


Discussion:

Trying to count each individual cell was ridiculously difficult. So we divided each slide into quadrants in order to try to effectively get the most accurate count, then we multiplied each quadrant by 4. This still produced inaccurate results because it was very hard to actually get an accurate count of the cells. This is an example of why.
As one can see it is incredibly difficult to count these cells and especially with the given amount of time we had. We simply could not count them fast enough to get an accurate reading. But from our data one can conclude that starting on the initial time the single haploid cells were more numerous than the budding haploid cells, but then the numbers were reversed at about 24 hours. Where there was more budding haploid cells than single haploid cells, but then the numbers of budding cells reduced again probably because of the reduced amount of space to divide and the cells were sending messages saying that they are running out of room and to stop reproducing. That is what can be observed from the Alfa and A types. Where in the mixed culture the number of single haploid cells becomes reduced over time where the number of budding zygotes and asci increase as time passes.

The experiment could have been improved and made more accurate if we had more time to count and been able to easily take pictures of the cells so that they wouldn't be moving and increasing to the difficulty of the counting.


Conclusion:

As one can conclude from the data the a and alfa cultures had a majority of single haploid cells but then as time passed more budding haploid cells were made, but as more time passed the budding haploid cells had begun to recess and at the end there were a majority of single haploid cells. And in the mixed culture as time passes the single haploid cells are reduced and the concentration of of zygotes and asci are raised.

Monday, December 9, 2013

Photosynthesis Lab

Photosynthesis Lab

Purpose: the purpose of this lab is to prove that chlorophyll and chloroplasts are used in the production of oxygen in plants. Denaturation of spinach proteins were tested to show that chloroplasts were no longer useful when denatured. The independent variables were the drops of DPIP which were used to show that chlorophyll was actually functioning. The dependent variables was the light,as in the control sample we were able to completely block off all the light which was supposed to enter the cuvette with a piece of aluminum foil. We were also able to change the state of the spinach by using it either boiled or raw.


Introduction:The equation for photosynthesis is 6 CO2 + 6 H2O -> C6H12O6 + 6O2. Photosynthesis has 2 parts: the light reactions and the Calvin cycle. The light reactions occur in the thylakoid membrane, where water is split and oxygen is released and ATP and NADPH are produced. The Calvin cycle takes place in the Stroma and is powered by the ATP and NADPH produced by the light reactions in order to fixed CO2 into sugar. The function of the plant pigments is to absorb light and reflect it to  the reaction centers during the light reactions. The relationship between light intensity and photosynthetic rate is directly proportional so the rate of photosynthesis increases as light intensity increases up until a certain point.  


Methods:  starting off the experiment, each of the cuvettes were filled with a spinach solution, either raw or boiled. DPIP was added to them as well, which was there to be eaten up by the chlorophyll as light reactions would function. If the DPIP was not eaten up and the solution remained blue, the chloroplasts did not function. A control cuvette used to recalibrate the sensor was made the same way as the previous cuvettes with the raw spinach, but it was wrapped in aluminum foil to prevent any sort of light from reaching the chloroplasts. Each of the cuvettes was left in the light for same amount of time, (5,10, and 15 minutes)  and in the sensor for the same amount of time as well. This was to make sure everything was tested equally to provide us with the most accurate results.  


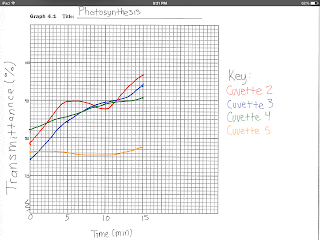
Data:
First Trial

Second Trial


Graphs:


Discussion:
The first trial that we did there was no change in the color because we did not put enough Dpip into the solution because all the Dpip was used up right away and it was impossible to tell the difference over time. So we increased the concentration of the Dpip in order to be able to better see the change in Dpip used. In the experiment one can determine the amount of Dpip used because the translucency in the solution will become closer to 100%. Ans when The Dpip is not used the colorometer will read something less than 100% because the bluish tint will bring down the translucency.


Conclusion:
As the graph shows, the unboiled light and the unboiled dark were the only solutions to significantly increase in the translucency. the unboiled light was as predicted because it would be the only one that the chloroplasts will be using the light to consume the Dpip. And the only logical reason we can think of why the unboiled dark increased in translucency is because during the short time where we took the sleeve off and put it in the colorometer the chloroplasts activated and consumed the Dpip. 


Resources:
Campbell biology ninth edition

Monday, November 18, 2013

Cellular Respiration Lab


Purpose: 

The main objective of this lab was to find out the rate of respiration in dormant seeds, seeds which were germinated, and seeds which were germinated and added to cold water. The temperature was the dependent variable as it was changed from room temperature to ice cold water. The environment, sensor and type of seed used remained the same, making it the independent variable. The main focus was to see the difference temperature makes in the respiration of germinated and non-germinated seeds.

Introduction:
Cellular respiration is a form of aerobic respiration in which glucose is broken down in in order to produce ATP. The general formula for cellular respiration is C6H12O6 + 6O2 --> 6CO2 + 6H2O + energy. This process takes place in the mitochondria. Cellular respiration has 3 stages: glycolysis, citric acid cycle, and oxidative phosphorylation. At each of these stages, ATP is produced. During glycolysis, glucose is broken down into 2 pyruvate molecules. 2 ATP is required to phosphorylase glucose but 4 ATP are produced and 2 NADH. The pyruvate is then oxidized to acetly CoA and then goes on to the citric acid cycle. The citric acid cycle then produces 4 CO2  , 6NADH, 2FADH2 ,and 2 ATP. Finally, in oxidative phosphorylation, the electron transport chain and chemiosmosis are combined together. The total yield for a single molecule of glucose is 30-32 ATP.  Temperature affects the rate of respiration.
Methods:

25 similar pea seeds which were germinated had been counted and picked out along with 25 dormant seeds and 25 glass beads. The glass beads were used as a control group. We first tested the germinated seeds by simply putting them in a container covered with the respiration sensor. Then we had the germinated seeds sit in ice cold water and once again put them in the container covered with the sensor. The same thing was done with the dormant seeds to use as comparison. The glass beads were a control group to act against the dormant and germinated seeds. 
We used the Lab Quest to take all the CO2 measurements

The germinated seeds at room temperature


The cup of cold water that the seeds were to be put into

The seeds soaking in the Ice Water

Data:

The rate of respiration for all seeds

Graphs:
The CO2 Graph of the germinated seeds at room temperature

The CO2 Graph of the non-germinated seeds at room temperature

The CO2 Graph of the Germinated seeds after submerged in Ice water
 Combonation of all graphs 
Blue= Germinated at room temp
Purple= Germinated after submerged in ice-water
Green= non-germinated seeds
Red= Glass beads that served as constant

Discussion:

The rate of respiration for the peas at room temperature was .32 ppm/s. The rate of respiration for the peas at the cold temperature was .97 ppm/s. The rate of respiration for the non germinating peas was .05 ppm/s. The average rate of respiration for the peas was .446 ppm/s. The average rate of respiration for the glass beads was .015 ppm/s. The respiration rate was higher for the germinating peas when compared to the respiration rate for the non germinating peas. The temperature of the water also had an effect on the respiration rate of the peas. The peas that were in then cold water had a higher rate of respiration than the peas that were in the water at room temperature

Conclusion:

As shown in the graphs above it is obvious that the germinated seeds produce the most co2, but their co2 production rate decreases after they have been submerged in water. Also it should be noted that the non-germinated seeds barely produced more co2 than the glass beads. So it can be determined that the non-germinated seeds produce little or if not any co2.

 Reasources:

Campbell Biology Ninth Edition