Diffusion and Osmosis Lab
Purpose:
1A) In this experiment diffusion of small molecules through dialysis tubing was tested to prove a selectively permeable membrane. The dependent variable consisted of the color and change in starch. The independent variable was the IKI which did not change.
1B) Exercise B shows the relationship between the movement of water through a cell membrane is related to the concentration of a solute. We were trying to see if the differing amount of a solute located inside the cell would change the amount of water that diffused through the cell through osmosis
1C) The purpose of this lab was to determine the water potential of potato cells. This was to be determined by placing potato cores in solutions with different molar concentrations of sucrose and recording the % change in mass of the cores. By finding the molar concentration of sucrose when there is a 0% change in mass, we could then find the molar concentration of the potato cores and then determine its water potential.
1E) The purpose of this lab was to examine the effects that a high concentrated solution would have on diffusion and the cell of an onion. This would be done by placing the onion in
Introduction:
1A)Different cells may have different membranes which control what comes in and what leaves the cell. In this experiment, this was exactly what was tested. Selectively permeability is extremely important to a cell. A cell cannot let anything and everything in. The membrane only allows certain molecules of a certain size in and out.
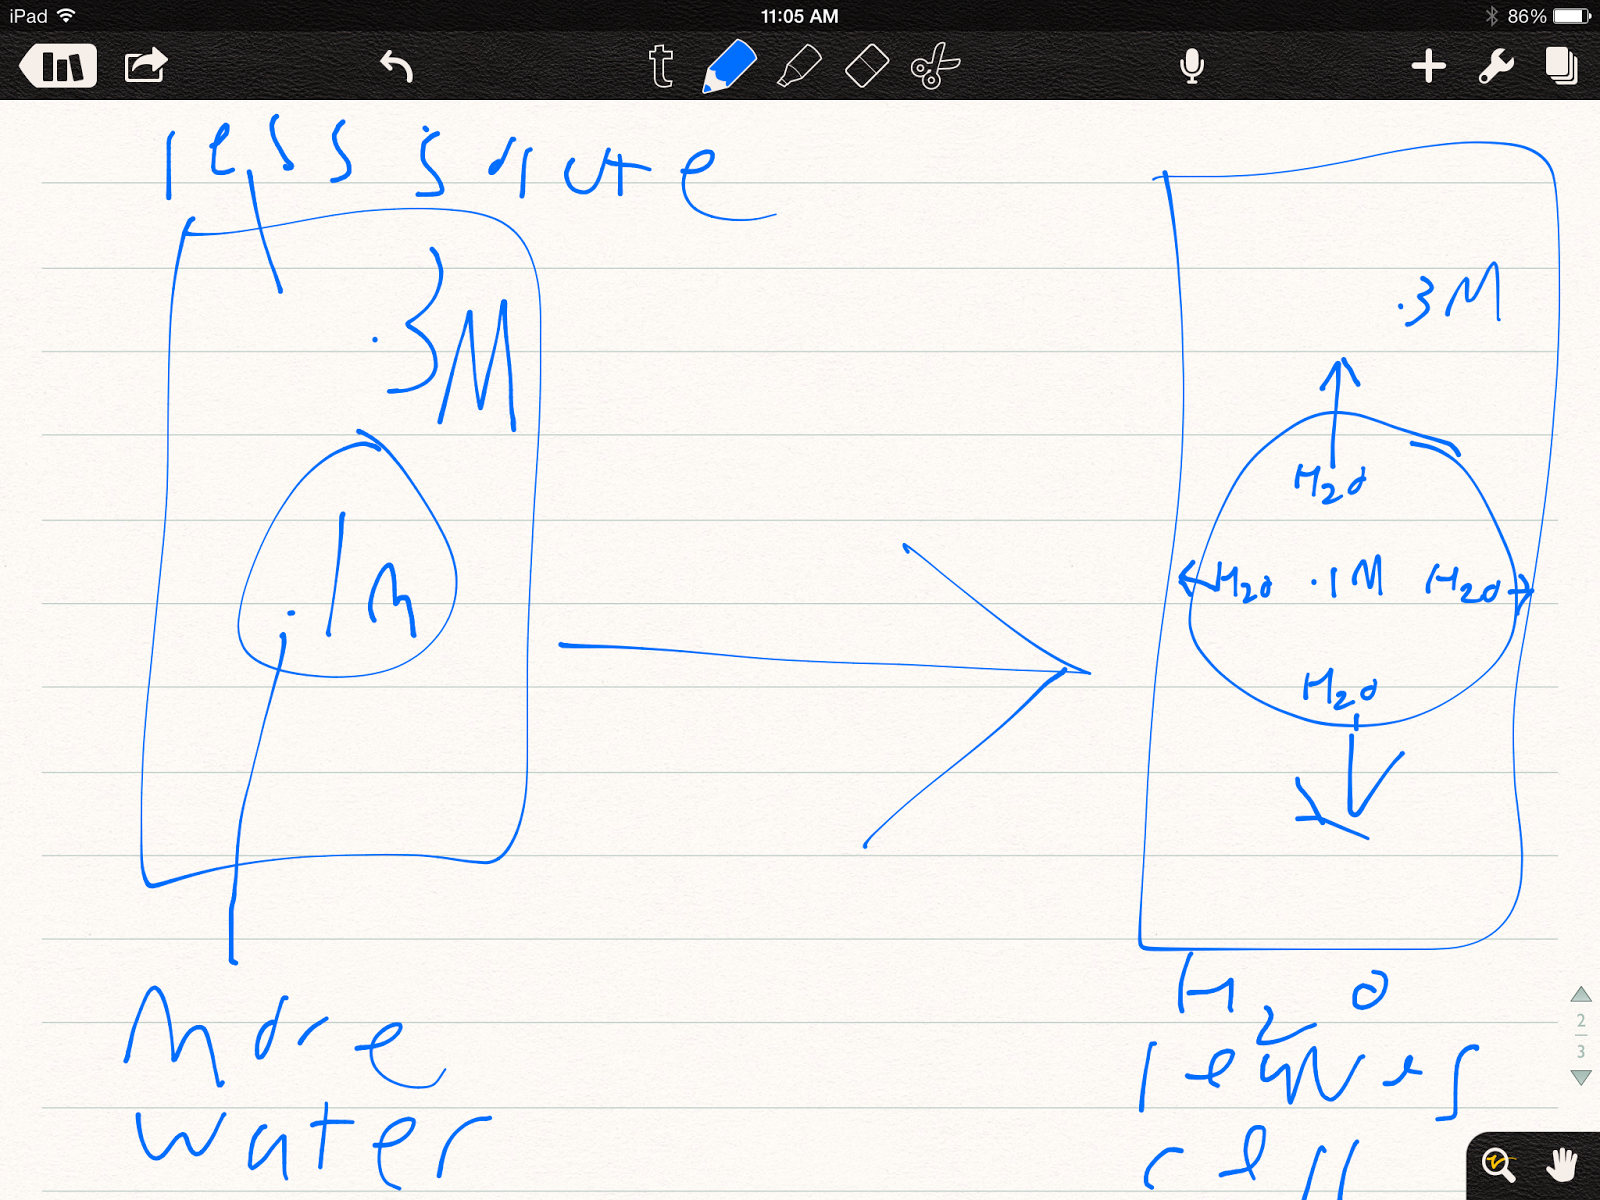
1B) Two solutions that have the same concentration of solute will be iso tonic. So water will be able to move freely through a selectively permeable membrane but the change in the amount of water in both solutions will stay the same. However if these two solutions have different concentrations of a solute (one being less and one being greater) the change in the amount of water on either side will be different in order to balance out the solution.
Hypertonic


1C) Water potential is a measurement of the tendency of water to move from one place to another. Water potential is equal to the pressure potential added to the solute potential. Solute potential is the effect of solutes on overall water potential. It is always a negative value and it is inversely related to water potential. An increase in pressure potential also increases the water potential. Water will always move from an area of higher water potential to an area of lower water potential. When the water potential of the cell and the water potential of the liquid are the same, dynamic equilibrium has been reached and there will be no net movement of water. When a cell is placed in an iso tonic solution, the solute concentration of the cell and the solution are equal and there is no net water movement across the plasma membrane. When a cell is placed in a hyper tonic solution, the solute concentration is greater than that inside the cell and the cell loses water. When a cell is placed in a hypo tonic solution, the solution con creation is greater than that inside the cell and the cell gains water.
1E: When placed in a hypertonic solution, the solute concetration is greater than that inside the cell and the cell loses water. When placed in a hypotonic solution, the solute concetration is less than that inside the cell and the cell gains water. When placed in an isotonic solution, the solute concetration is the same as that inside the cell, and there is no net water movement across the plasma membrane. When placed in a hypertonic solution, the cell undergoes plasmolysis and the cytoplasm shrinks and the cellular membrane pulls away from the cell wall.
Methods:
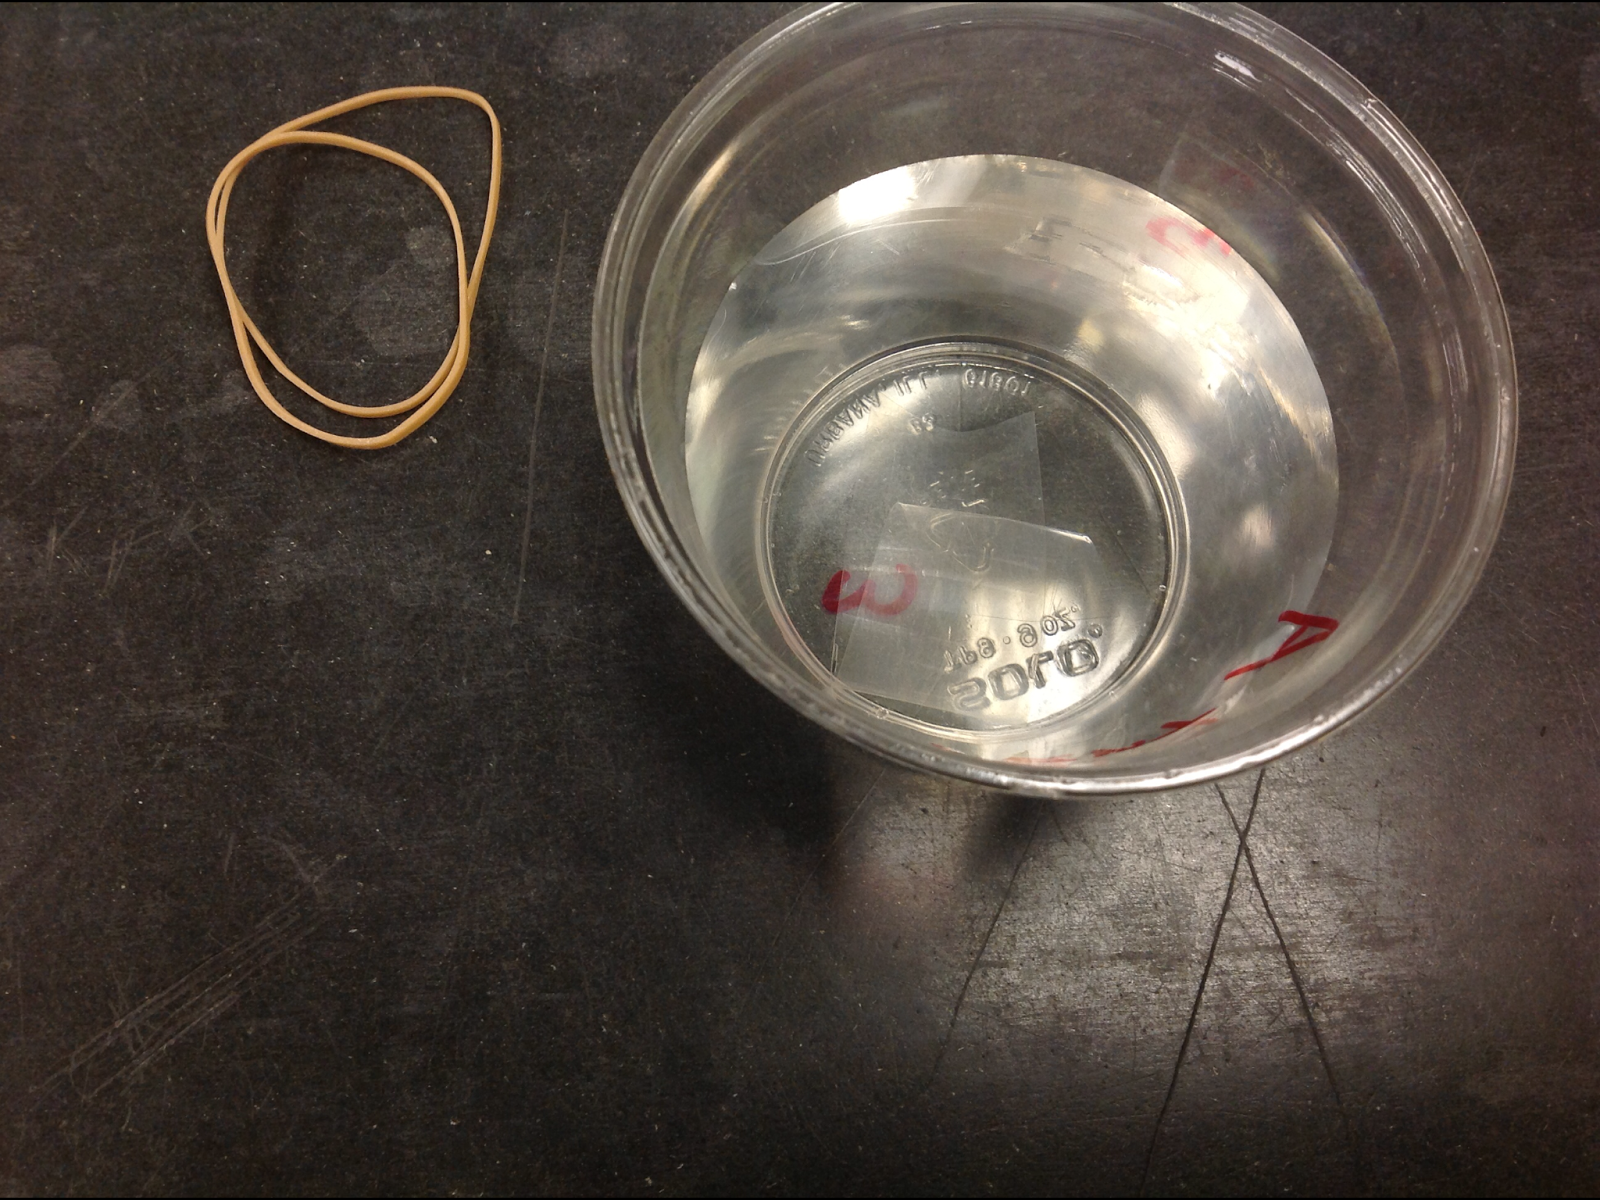
A) In order to stimulate and explain a cells selectively permeable membrane, a piece of dialysis tubing was cut to size and filled With 15% glucose and 1% starch solution. This dialysis tube, now a baggie, was dropped in a cup of IKI. We left the dialysis tube in with the iodine for approximately 30minutes. The bag was then removed and we began observing changes.
B)we filled six dialysis bags with differing amounts of sucrose concentration. These will be our cells with either hypo, Iso, or hyper tonic cells. We then weighed them in order to have their original weight to compare once the test was over. The "cells". We're then submerged inside a cup of water for thirty minutes. After the thirty minutes, the "cells" were weighed again in order to see if there was any difference in the weight. If there was a higher weight that would mean water went into the cell, and if there was a lower weight that would mean that water came out of the cell.
C) For this experiment we cut 24 potato cores and separated them into groups of 4. We weighed each group and recorded it on the date table. Then we placed each group into a cup that contained either 0.0M distilled water, 0.2M sucrose, 0.4M sucrose, 0.6M sucrose, 0.8M sucrose, or 1M sucrose. We then covered the cups and let them sit overnight. The next day we took out the potato cores, blotted them, and then weighed each group and recorded the new weight of the cores on the data table. Then we found the change in mass of the potato cores in each liquid and calculated the % change in mass.
1E) For this lab we observed a piece of an onion under a microscope. First we put 15% NaCl and then freshwater on the onion and observed the effects of it on the onion cell.
Data:
1B
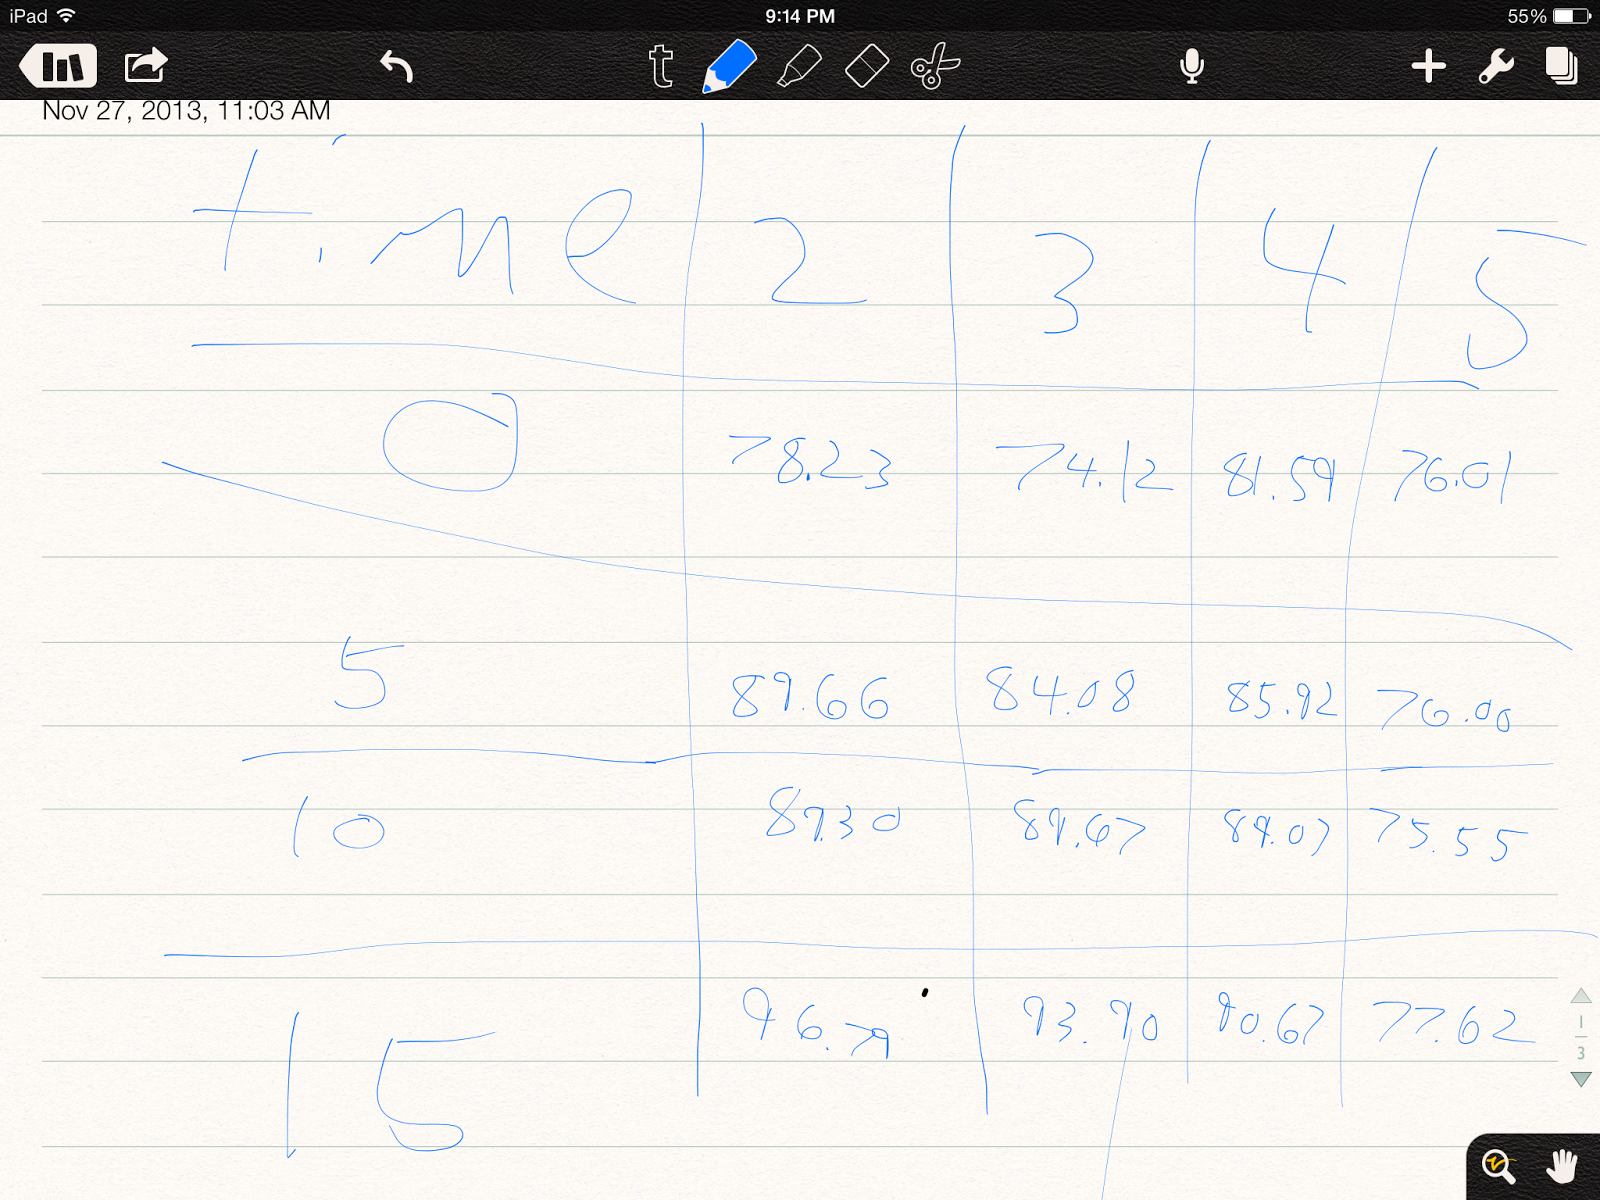
1C
Graphs
1C
Discussion:
1A) Starting off, the baggie contained 15% glucose and 1% starch and the solution was colorless. The baggie was then added to a solution of water and IKI which was a dark yellow color. After sitting for 30minutes, the solution inside the baggie was a dark blue color and the solution in the cup was still a dark yellow. This clearly explains concept of a semi permeable membrane. As we predicted, the starch in the baggie would react with the IKI as in passed through the semi permeable membrane of the baggie. To prove that it was only the starch that reacted to the IKI, we tested and realized that both at the beginning and at the end of the experiment the glucose remained the same. This was done with glucose testing strips. At the beginning the glucose tested at 15 inside the baggie and 30 on the outside. At the end, we dipped the glucose testing strip once again and it tested at the same as in the beginning. The results matched our predictions, as we said glucose molecules are too big to get through the selectively permeable membrane, but since the starch molecules are a lot smaller they would make it through
1B) After we pulled the bags out of the water and weighed them we noticed that the bag with just distiller water weighed the same as when we put it in originally. This was expected because it is just water , so no extra water needed to be added or removed to create a balance inside the cell. But then as the molar it you'd sucrose inside the cell increased so did the % change in mass. The more concentration of sucrose inside the bag the more amount of water went into the cell. The amount of water that was let in steadily increased as the molar it's went up. Starting with only a 2% increase in mass at .2M of sucrose, alluded way to a 10% mass increase in the 1.0M of sucrose. This experiment clearly showed how a hypo tonic cell will tend to take in more water in order to equalize itself with the concentration on the outside. The experiment did exactly what we thought it would, we thought that the higher the molarity, the more water the cell would take in, in order to equalize the outside.
1C) As the potato cores were placed in solutions with higher molar concentrations of sucrose, the % change in mass of the cores became more negative. When the potato cores were placed in 0.0M distilled water or 0.2M sucrose, the potato cores' mass increased and the % change in mass was positive. This means that the cores were placed in a hypo tonic solution and they gained water and mass. When the cores were placed in .4M sucrose, .6M sucrose, .8M sucrose, or 1M sucrose, the potato cores' mass decreased and the % change in mass was negative. This was because the cores were in a hyper tonic solution and they lost water and mass. Looking at the graph of the data, you can see that somewhere between .2M sucrose and .4M sucrose, the % change in mass would've been 0% and the molar concentration of sucrose would equal the molar concentration of the potato cores. This means that water potential of the water with that molar concentration would equal the water potential of the potato tissue. This concentration is approximately .23M sucrose. An inconsistency in the data is at .8M sucrose. The % change in mass should've followed the trend and been more than the % change in mass of .6M sucrose but instead it was less. A better way to improve results and get more accurate results would be to have a way to dry all the potato cores the same way so that some wouldn't lose more water than others.
1E) When the 15% NaCl was added to the onion, the cell was in a hypertonic solution and the cell underwent plasmolysis and lost water. However when freshwater was added to the onion, it was in a hypotonic solution and the onion cell gained water.
Conclusion:
1A) Selectively permeable membranes are extremely important in a cells life. They play a huge role in keeping the cell safe and satisfied. This was proven in this experiment after the starch in the dialysis baggie reacted with the IKI on the outside, which shows us how the difference in size of starch and glucose played an important role in getting through the selectively permeable membrane.
1B) All in all this experiment showed that an iso tonic solution will cause a cell to take in no extra water, but a hypo tonic solution will cause the cell to take on water in order for the inside and outside of the cell to reach an equilibrium.
1C) The molar concentration of sucrose at which its water potential is equal to the water potential of the potato tissue is approximately .23M sucrose. At this concetration, the solution has a water potential of -5.29 bars (.1M = -2.3 bars). Although the solute concetration of the potato tissue and the solution aren't equal, the pressure potential of the potato cells equals out the solute potential of the potato so that both water potentials are equal. Since there is no net movement of water at this concetration, this means that the water potential of the potato cells is equal to the water potential of the liquid. Therefore, the potato cores have a water potential of -5.29 bars.
1E) When the NaCl was placed on the onion cell it experienced plasmolysis. It then gained back water when it was placed in freshwater.


.PNG)


