Purpose:
The purpose of this lab was to see the effect of time on the mating on yeast cells. The dependent variable which was controlled was time. Yeast was kept for 30 minutes, 24 hours, and 48 hours. The independent variable was the number of yeast.
Introduction:
Cells communicate through signals that can either be local or long-distance. Signal transduction pathway is a series of steps in which a received signal is converted to a specific cellular response. There are 3 stages in cell signaling: reception, transduction, and a response. During reception, a target cell detects a chemical signal when the signaling molecule binds to a receptor protein. There are 3 major types of cell-surface transmembrane receptors: G protein-coupled receptors, receptor tyrosine kinases, and ion channel receptors. During transduction, the receptor protein is changed and the signal is converted to a form that leads to a specific cellular response. The multiple steps in transduction leads to amplification of the signal. 2nd messengers, such as cyclic AMP can also play a role in signal transduction pathways. Finally, the cellular response is triggered by the transducer signal. Cells of the yeast saccharomyces cervisiae, find their mates through chemical signaling and then initiate the mating process. The 2 mating types of yeast, a & alpha, secrete factors that bind to the receptor proteins on the other type of cell. When these factors bind to the receptors, the 2 cells grow toward each other and fuse together. The new a/alpha cell contains all of the genes from both cells.
Methods:
Yeast was obtained and dropped into three tubes of water. The tubes were labeled with alpha type, A-type and mixed. Different yeast was added to each tube, and a mix was added to the tube labeled "mixed." A reading was taken right away and yeast cells were counted. After 30 minutes, yeast cells were counted once again to see the reproduction. This was repeated once again after 24 hours and 48 hours. The yeast was split into three groups: alpha, a-type and mixed. Single haploid cells, budding haploid cells, shmoos, single zygotes, budding zygotes, and asci's were the type of cells that were accounted for under the microscope. After each slide was used and counted for, the slides were cleaned in bleach, in order to sterilize and zap the yeast to its death.
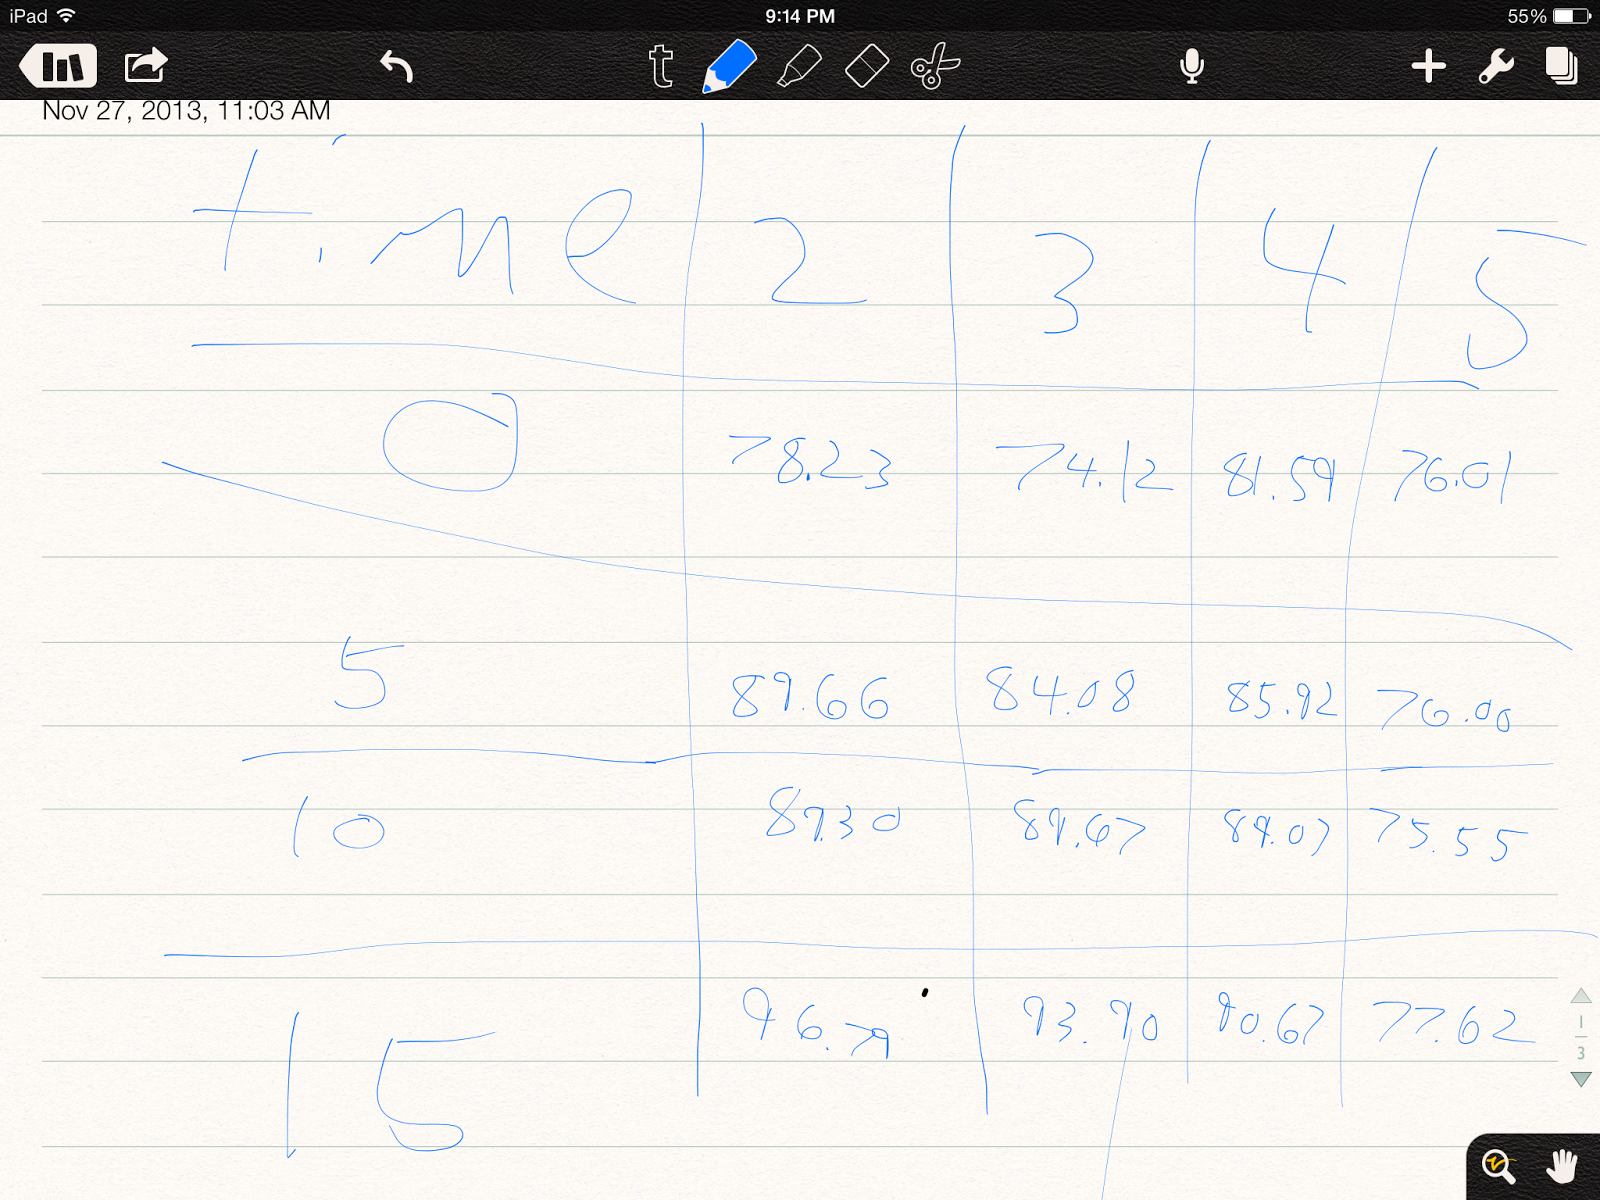
Data:


Graphs:
Alfa type

A type

Mixed type

Discussion:
Trying to count each individual cell was ridiculously difficult. So we divided each slide into quadrants in order to try to effectively get the most accurate count, then we multiplied each quadrant by 4. This still produced inaccurate results because it was very hard to actually get an accurate count of the cells. This is an example of why.

As one can see it is incredibly difficult to count these cells and especially with the given amount of time we had. We simply could not count them fast enough to get an accurate reading. But from our data one can conclude that starting on the initial time the single haploid cells were more numerous than the budding haploid cells, but then the numbers were reversed at about 24 hours. Where there was more budding haploid cells than single haploid cells, but then the numbers of budding cells reduced again probably because of the reduced amount of space to divide and the cells were sending messages saying that they are running out of room and to stop reproducing. That is what can be observed from the Alfa and A types. Where in the mixed culture the number of single haploid cells becomes reduced over time where the number of budding zygotes and asci increase as time passes.
The experiment could have been improved and made more accurate if we had more time to count and been able to easily take pictures of the cells so that they wouldn't be moving and increasing to the difficulty of the counting.
Conclusion:
As one can conclude from the data the a and alfa cultures had a majority of single haploid cells but then as time passed more budding haploid cells were made, but as more time passed the budding haploid cells had begun to recess and at the end there were a majority of single haploid cells. And in the mixed culture as time passes the single haploid cells are reduced and the concentration of of zygotes and asci are raised.